Setting up ELK on my MacBook (Part 1)
I am starting up a new run of blog posts to document some malware analysis work I have been doing lately. Since I got my new MacBook, I have used the new hardware to as an opportunity to rebuild my setup from scratch. I am using Elasticsearch, Logstash, and Kibana on my MacBook and WinLogBeat and PacketBeat on my Windows 10 VM. This is post is meant to help me rebuild my ELK stack on MacBook the next time I dork it up. I tried running installing the stack in a few different ways but these are the steps I took that were ultimately successful.
1. Create some folders:
mkdir ~/Applications/ELK
cd ~/Applications/ELK
mkdir Data Logs
I put this off of my profile because as soon as I start burying it off in some directory off of root like a proper admin I can’t remember where I put it.
2. Download Elasticsearch:
Elasticsearch is a highly scalable open-source full-text search and analytics engine. It allows you to store, search, and analyze big volumes of data quickly and in near real time. Download your copy from here: https://www.elastic.co/downloads/elasticsearch Specifically I downloaded the elasticsearch-5.2.2.tar.gz and extracted it to the ELK folder.
tar -xvzf elasticsearch-5.2.2.tar.gz3. Configure Elasticsearch:
One of the things I ended up doing in my setup was changing the configuration from localhost to 0.0.0.0. I did this because, in addition to Malware Analysis VMs on my MacBook, I also have other boxes around my lab that I wanted logs from as well.
To do this crack open ~/ELK/elasticsearch-5.2.2/config/elasticsearch.yml in your favorite text editor and change:
# ---------------------------------- Network -----------------------------------
#
# Set the bind address to a specific IP (IPv4 or IPv6):
#
#network.host: 192.168.0.1
to:
# ---------------------------------- Network -----------------------------------
#
# Set the bind address to a specific IP (IPv4 or IPv6):
#
network.host: 0.0.0.0
If you are just doing this for local logging, the default configuration is fine.
Next I changed the default Log and Data directories because this allows me to be more resilient when I screw something up and need to reinstall. Also in ~/ELK/elasticsearch-5.2.2/config/elasticsearch.yml, change:
# ----------------------------------- Paths ------------------------------------
#
# Path to directory where to store the data (separate multiple locations by comma):
#
#path.data: /path/to/data
#
# Path to log files:
#
#path.logs: /path/to/logs
to…
# ----------------------------------- Paths ------------------------------------
#
# Path to directory where to store the data (separate multiple locations by comma):
#
path.data: /Users/glass/ELK/Data
#
# Path to log files:
#
path.logs: /Users/glass/ELK/Logs
4. Run Elasticsearch to make sure it works:
./elasticsearch-5.2.2/bin/elasticsearchOnce that is running, in a separate tab, curl the service to make sure you are good to go.
curl -XGET http://localhost:9200/and you should see something like this:
{
  "name" : "D4i86Xk",
  "cluster_name" : "elasticsearch",
  "cluster_uuid" : "YNTg9_EpQ46-TDcfKqdgRw",
  "version" : {
    "number" : "5.2.2",
    "build_hash" : "f9d9b74",
    "build_date" : "2017-02-24T17:26:45.835Z",
    "build_snapshot" : false,
    "lucene_version" : "6.4.1"
  },
  "tagline" : "You Know, for Search"
}
3. Download Kibana:
Kibana is an open source (Apache Licensed), browser based analytics and search dashboard for Elasticsearch. I grabbed kibana-5.2.2-linux-x86_64.tar.gz and unzipped it in my ~/ELK directory.
tar -xvzf kibana-5.2.2-linux-x86_64.tar.gzI left the default configuration alone because I didn’t need to change anything.
4. Run Kibana:
~/ELK/kibana-5.2.2-darwin-x86_64/bin/kibanaFor me, it looks like this:
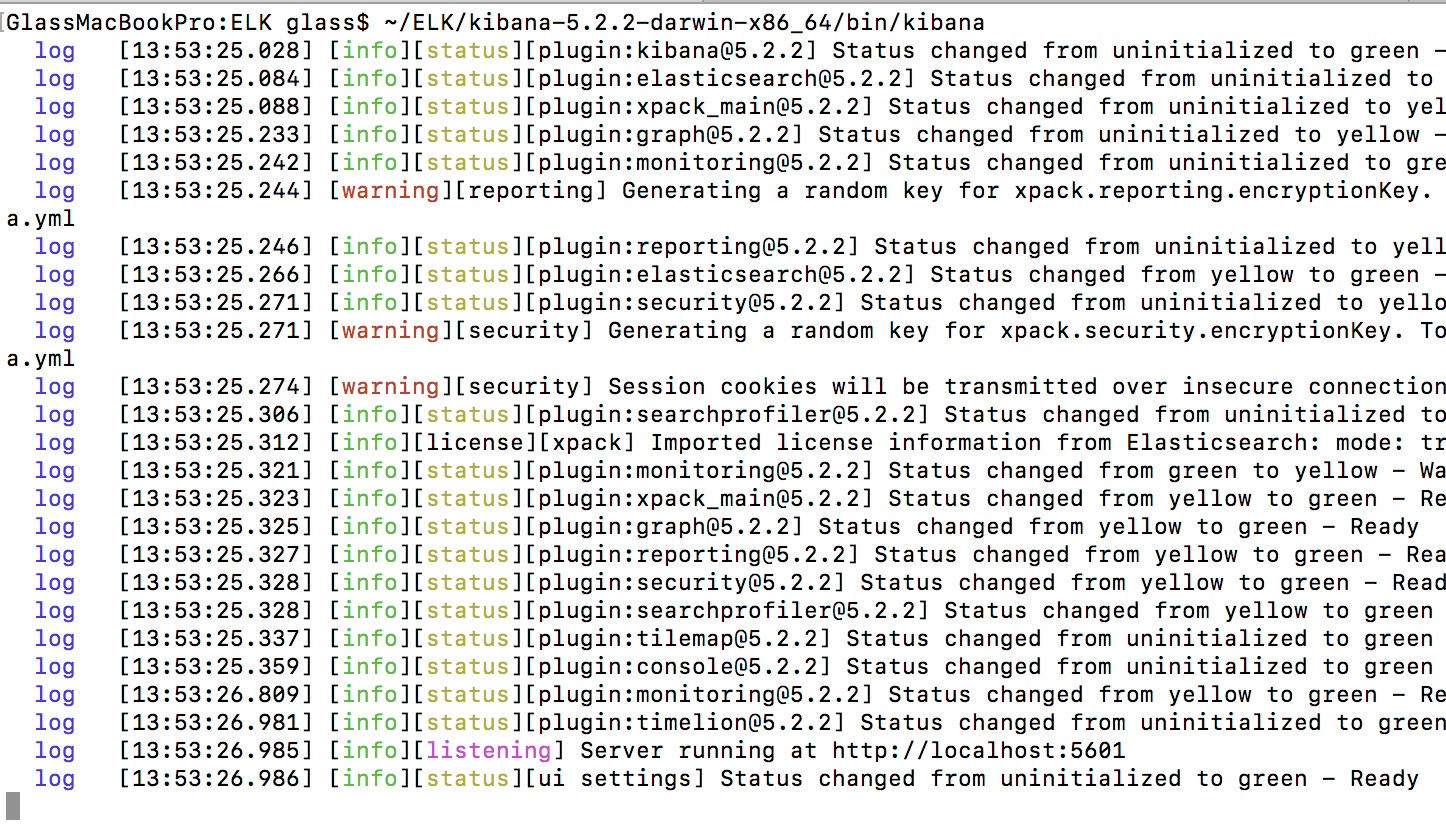 So, for those ELK stack nerds out there: “You’re right. My first time running Kibana did not look exactly like this because I have installed some plugins.” You caught me not taking screenshots in a timely manner. Feel free to file a complaint and I will refund your subscription fee to this blog. The point is there at the bottom: green means good.
Fire up a browser (I like chrome) and navigate to http://localhost:5601 and should look like this:
So, for those ELK stack nerds out there: “You’re right. My first time running Kibana did not look exactly like this because I have installed some plugins.” You caught me not taking screenshots in a timely manner. Feel free to file a complaint and I will refund your subscription fee to this blog. The point is there at the bottom: green means good.
Fire up a browser (I like chrome) and navigate to http://localhost:5601 and should look like this:
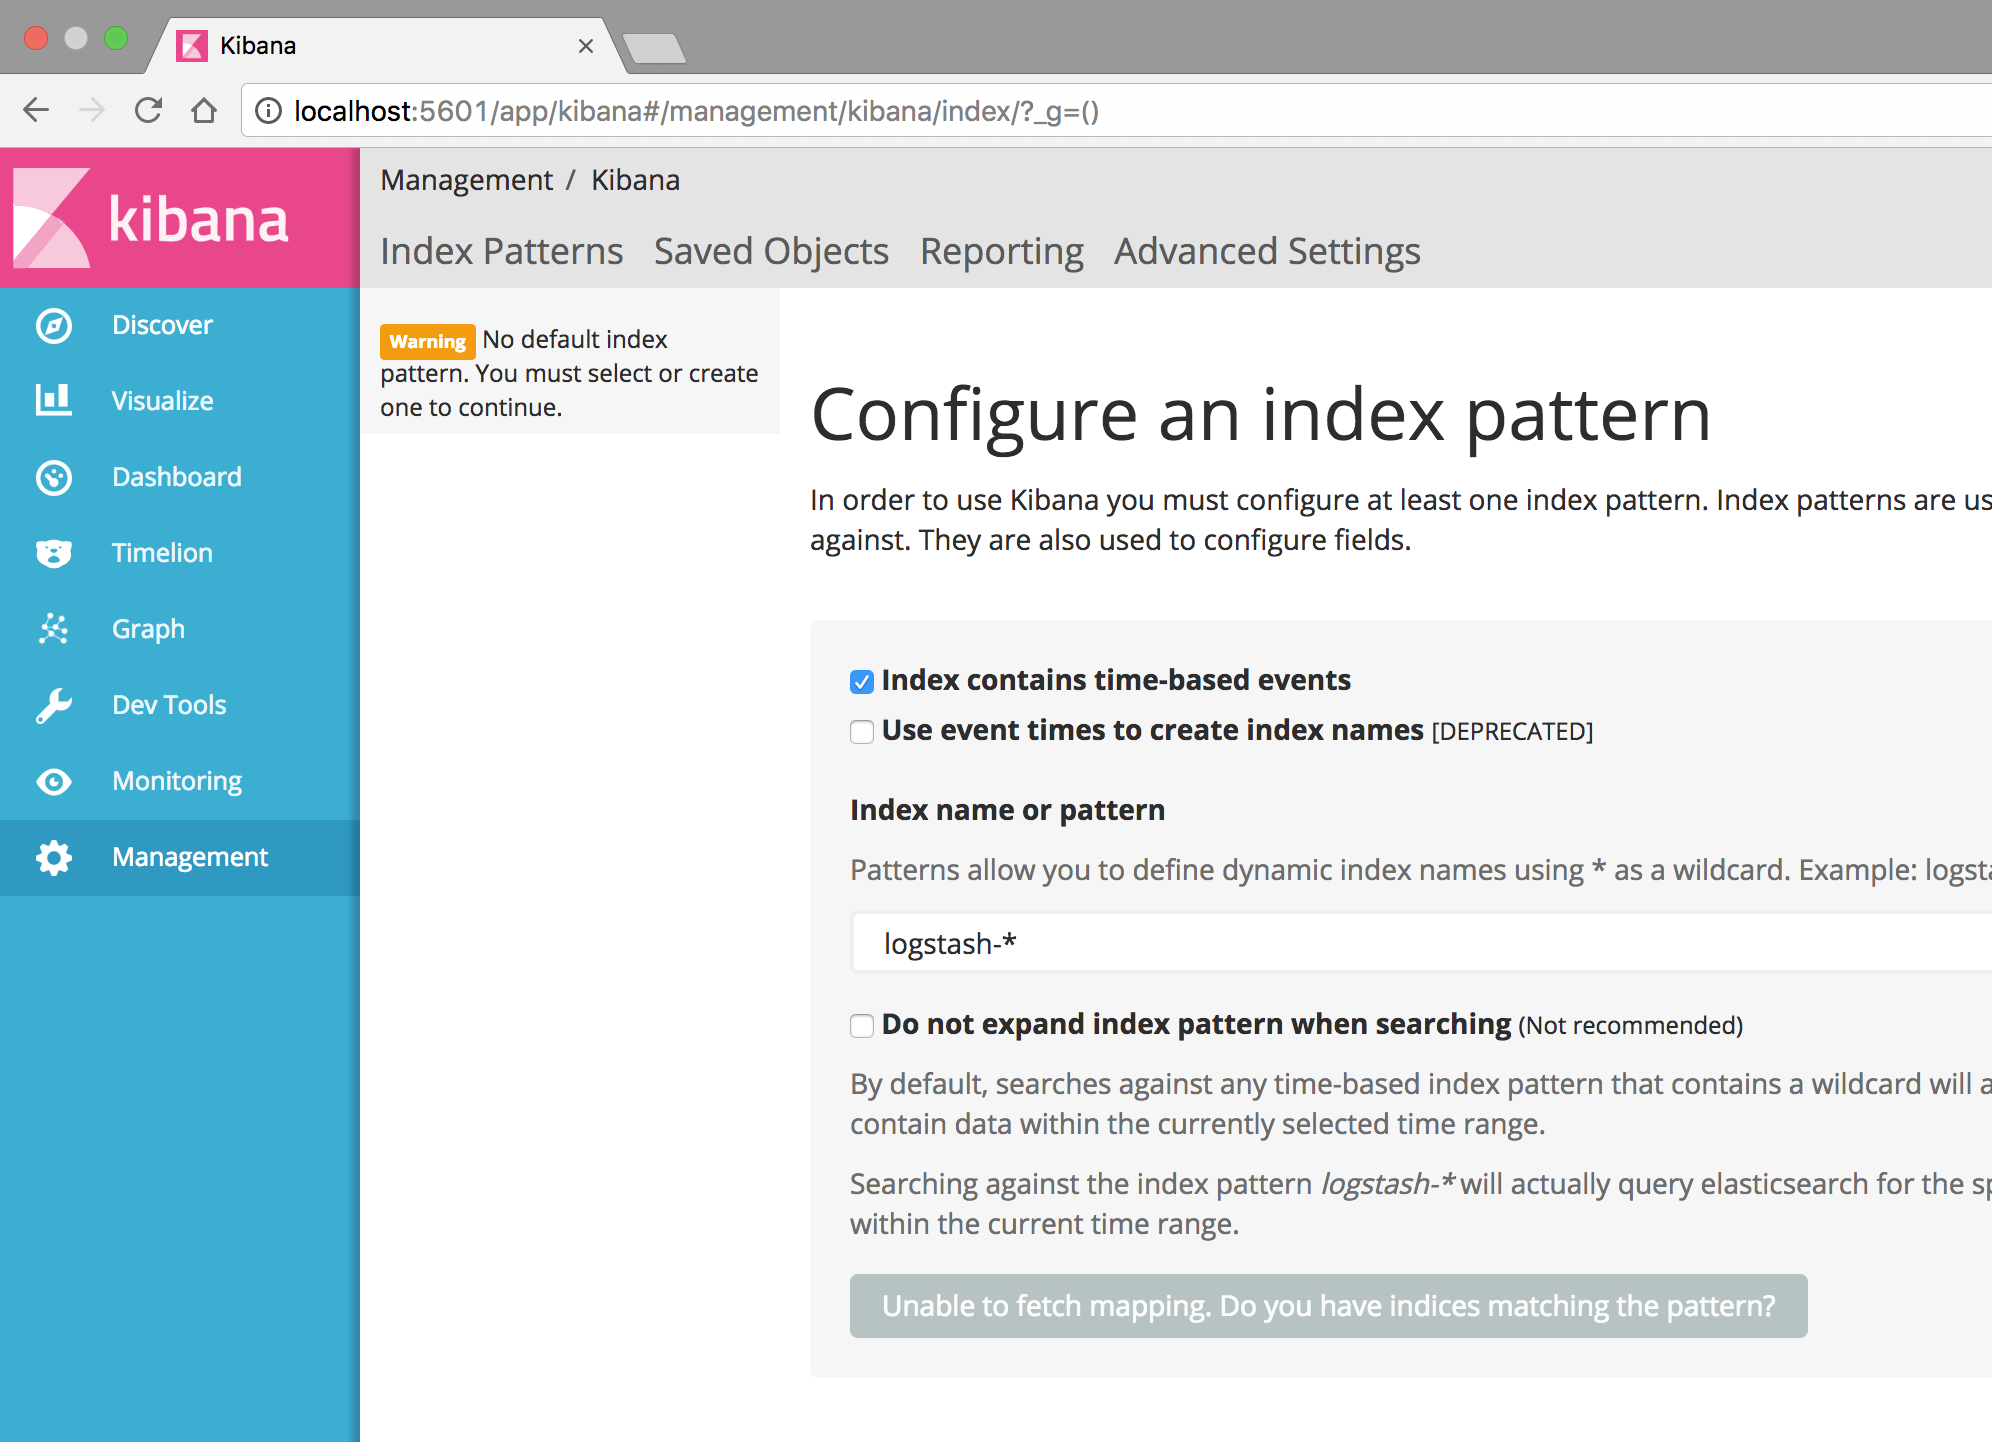 You will notice that it is immediately complaining about not having an index pattern. That is normal. So far we are good. In my next post, I will cover how I am sending logs into Elasticsearch from my VMs using WinLogBeat and PacketBeat.